In early May, a headline caught my eye regarding a drop in Etsy’s revenue. I’ve also been monitoring a variety of social media platforms, and have watched a number of interesting dialogs and commentaries on individual artisan results recently on Etsy.
While I talk about a number of different artisan platforms as part of Handmade Seller magazine, there are two big reasons I watch to see what Etsy is sharing. 1.They are a large player in the artisan industry and 2.They often talk about what is happening in the broader macroeconomic environment. i.e. what’s happening with the broader economy where you live and how that will affect your business. They have more people watching economic indicators than any of our individual small businesses. Understanding what is being shared about the reality of economic cycles gives you more information with which to make objective business decisions. And you can get all this information without even selling on their platform!
I’ve analyzed Etsy’s most recent earnings release. I’ve also analyzed their most recent 5 years of results to get a better sense of Etsy’s trends. Etsy is a publicly traded company so they file quarterly reports with the SEC in the US and have public investor calls to share their financial results. This will be the first in a series of articles on what is behind Etsy’s financials. To be very clear- this is not a commentary, this is an analysis piece. I am not weighing in on whether any of this is good or bad, I am simply sharing what their data tells us.
Etsy is a complex company. They currently have what they refer to as a “House of Brands”. Etsy, Reverb and Depop. They have sold a Brazilian marketplace called Elo7 (which also makes reading some of the financial reports a little more complex).
In analyzing the financial results, I focused on several items that I believe artisan business owners would like to understand:
- What are the gross merchandise sales on the marketplace?
- What are the revenue sources- how much is fees on products sold versus services (listing fees, advertising, etc).
- How many active sellers are on Etsy?
- How many active buyers are on Etsy?
The data provided tells us an interesting story about how Etsy is evolving as a platform. I’ve also created some of my own simple graphics to compile information from their financial reports.
Gross Merchandise Sales on Etsy Platform
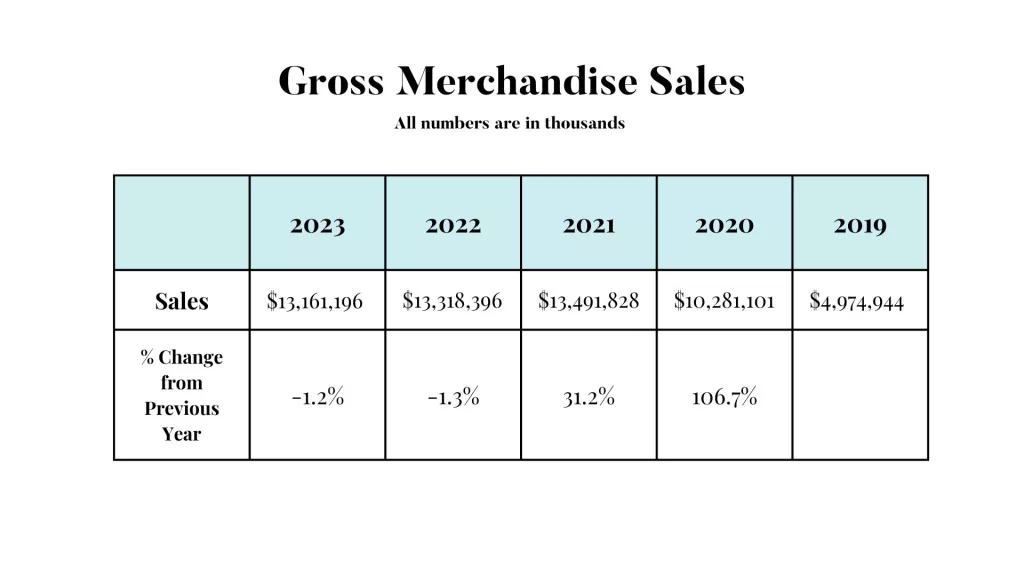
Gross merchandise sales on Etsy are the sum of all merchandise sold through the platform. Marketplaces exist to bring together buyers and sellers of products. Their revenue is a percentage of all sales on the platform. As the number and amounts of goods on a platform increase, there should be a natural increase in revenue.
If you would like an incredibly good read about how marketplaces work in general, I highly recommend Colin Gardiner’s work. His article “Why is Marketplace Revenue so Funky?” is a particularly insightful article about the mechanics of marketplaces.

Sources: https://d18rn0p25nwr6d.cloudfront.net/CIK-0001370637/0fb17b49-062e-454f-b7e7-64158ece22d3.pdf
https://d18rn0p25nwr6d.cloudfront.net/CIK-0001370637/4e43d306-4e72-462c-8f1a-bcb19b770718.pdf
As you can see in the chart, overall gross marketplace sales peaked in 2021 at about $13.4 billion. They were down slightly in 2022 and 2023, with 1.3% and 1.2% declines.
Focusing on the first quarter of 2024, there was a continued deterioration in sales on the marketplace. Etsy shared “Etsy marketplace GMS was $2.6 billion, down 5.3% Y/Y *, a bit of a disappointment as March GMS did not improve as we had anticipated”. Y/Y in financial reports means this year versus last year.
Now, are you wondering what that asterisks was referring to? Here is the fine print “*Etsy marketplace GMS down 5.6% Y/Y on a currency neutral basis”. What does this mean? Currency conversion effects for multinational companies are very common. If you have ever sold in a currency other than your local home currency, you are well aware of the effects of currency changes. Large companies often have currency programs in place to try to net out the effects of these currency fluctuations. But they cannot eliminate them entirely. For Etsy, holding currency neutral overall sales were down 5.6%.
However, it is not all bad news. There does appear to be a silver lining in the early results of the new Gifting experience on Etsy. This is where Etsy’s access to other industry data comes in handy. According to their financial release:
“Q1 24 Etsy sitewide ‘Gifting’ GMS meaningfully outpaced overall Etsy marketplace performance – up low single digits Y/Y. We also significantly outgrew select online gifting-focused peers*”. And here is where the fine print comes in. How did they calculate this? “Etsy Gifting GMS: Estimate based upon word ‘gift’ in the listing title, shipped with a gift message, or other signal the item was purchased as a gift *Source: Consumer Edge spend data from sampling of credit card transactions from U.S. online ‘gifting’ peers Zola, Zazzle, Minted, Uncommon Goods, Hallmark and Mark and Graham.” Honestly, this is the part where meaningful data to compare can be hard to track down. Etsy was comparing their gifting results to the best data they could get from competitors and benchmarking. According to Etsy, gifting is a bright spot in the business.
Source:https://s22.q4cdn.com/941741262/files/doc_financials/2024/q1/Q1-2024-Earnings-Presentation.pdf
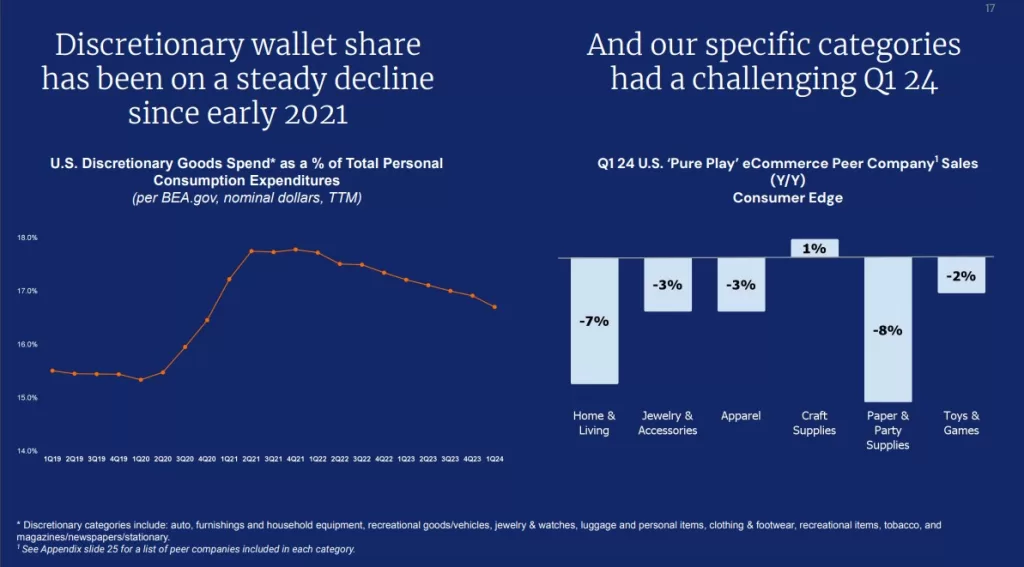
Now that we understand where they are at, what are they sharing about the broader economic picture? Looking deeper into the categories that Etsy is tracking, there are even more insights that are showing a challenging US economic picture.

Source:https://s22.q4cdn.com/941741262/files/doc_financials/2024/q1/Q1-2024-Earnings-Presentation.pdf
These numbers show that the consumer in general is spending less on discretionary goods, and has been for some time now. There was a huge increase at the start of the pandemic with so much economic stimulus in different places. Stimulus is over, and spending has leveled off and is returning closer to pre-pandemic levels. If you did not have a business before the pandemic, this may mean you are not used to more typical consumer spending levels and may need to make adjustments.
What are the Revenue Sources

Etsy splits their revenue into two different categories- Marketplace Revenue and Services Revenue. I have constructed this table from their financial reports and added some percentage calculations to make it easier to follow.
Etsy’s definition of Marketplace revenue states ”Marketplace activities include listing an item for sale, completing transactions between a buyer and a seller, and using our payments platforms to process payments, including foreign currency payments.”
Source: Etsy Annual Report Feb 2020: https://d18rn0p25nwr6d.cloudfront.net/CIK-0001370637/d63aa848-ac0c-474c-9350-5b18888e84bf.pdf
Per what Esty is sharing, Marketplace revenue is coming from those fees to run your baseline shop on Etsy- the cost to list, the cost when there is a sale, and the costs for processing payments. Some of the ways that Etsy can grow revenue are by charging additional fees for the administration of their services. For example, in 2024 Etsy added a new shop fee of $15 USD.
Etsy’s definition of Services Revenue states: “Services revenue is comprised of the fees a seller pays us for our optional services (“Services”). For the Etsy marketplace, primary optional services include advertising services, which allow Etsy sellers to pay for prominent placement of their listings in search results, and Etsy Shipping Labels, which allows Etsy sellers in the United States, Canada, United Kingdom, and Australia to purchase discounted shipping labels.”
Source: Etsy Annual Report Feb 2020: https://d18rn0p25nwr6d.cloudfront.net/CIK-0001370637/d63aa848-ac0c-474c-9350-5b18888e84bf.pdf
Services revenue is perhaps a little more controversial, as some of these services are not optional. For example, shops over a certain size are opted into advertising automatically. This means any sales attributed to advertising for those shops are not optional at all. However, we respect that Etsy gets to define the term in the way that makes the most sense for them to report as part of their financial reporting.
What are we seeing in these numbers? Etsy is continuing to grow both Marketplace Revenue and Service Revenue. However, Services Revenue is outpacing Marketplace Revenue. The “Optional Services” are continuing to be an important part of the revenue mix for Etsy. Knowing that offline advertising is part of this number, this makes us question if this is becoming more important, as the advertising is paid when the shop has a sale.
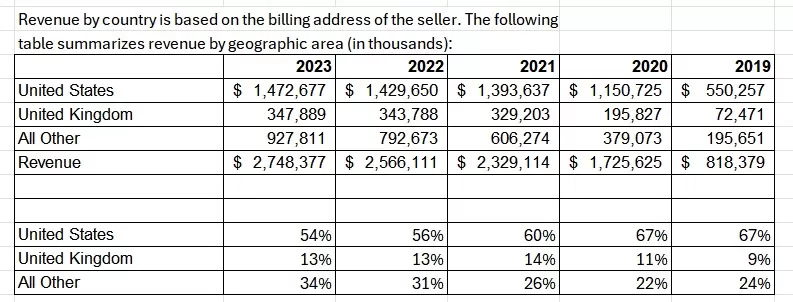
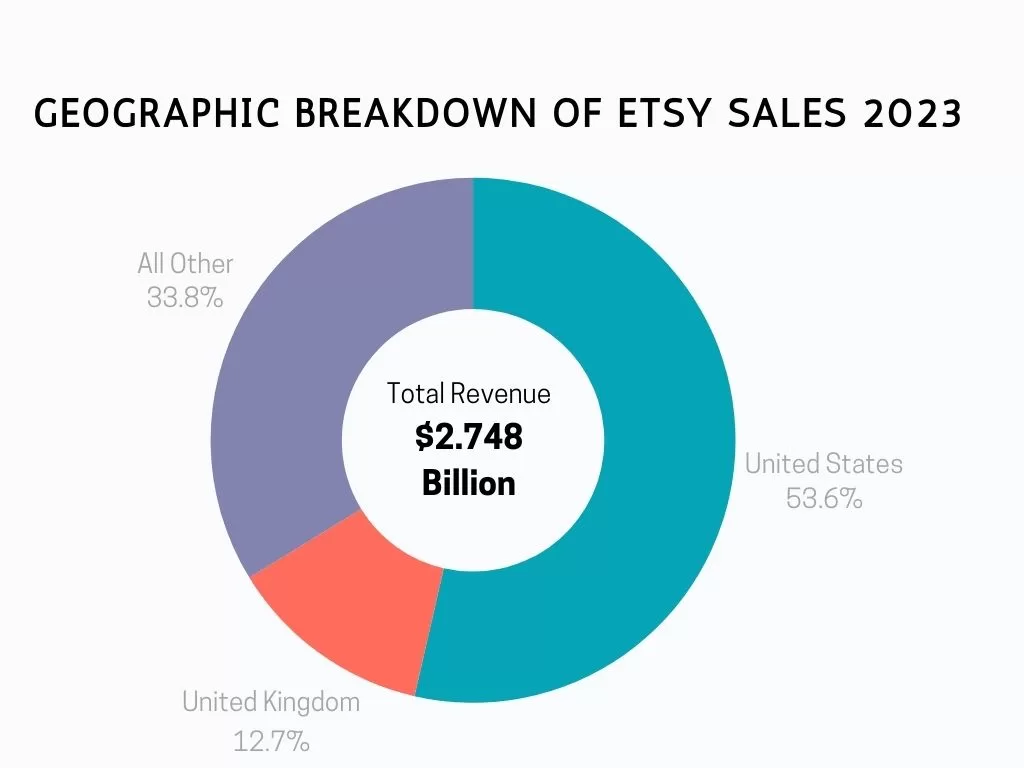
Where is the revenue coming from? We’ve analyzed what has been shared about the sources of revenue. Etsy does not break down the information any further than US, UK, and All Other. But analyzing the information shows us that the amount of revenue generated outside of the US and UK continues to grow each year.


Active Sellers on Etsy

Active Sellers definition: “An active seller is a seller who has had a charge or sale in the last 12 months. Charges include Marketplace and Services revenue fees, discussed in “Management’s Discussion and Analysis of Financial Condition and Results of Operations—Overview—Business.” A seller is separately identified in each of our marketplaces by a unique email address; a single person can have multiple seller accounts and can count as a distinct active seller in each of our marketplaces and we continue to exclude certain disqualified sellers. We succeed when sellers succeed, so we view the number of active sellers as a key indicator of consumer awareness of our brands, the reach of our platforms, the potential for growth in GMS and revenue, and the health of our business.”
As you can see, the number of sellers on the Etsy platform has absolutely exploded since 2019. It’s up a total of 330% since 2019. If it feels like the marketplace is more crowded, that is because it is. We don’t know the categories that these sellers are associated with, but we know that the overall marketplace has a substantially larger number of sellers.
Active Buyers on Etsy

Active Buyers definition: ”An active buyer is a buyer who has made at least one purchase in the last 12 months. A buyer is separately identified in each of our marketplaces by a unique email address; a single person can have multiple buyer accounts and can count as a distinct active buyer in each of our marketplaces. We generate revenue when buyers order items from sellers, so we view the number of active buyers as a key indicator of our potential for growth in GMS and revenue, the reach of our platforms, consumer awareness of our brands, the engagement and loyalty of buyers, and the health of our business.”
The active Etsy buyer statistics show that the number of buyers was at an all time high in 2023. However, given the dramatic increase in sellers on the platform, the ratio of buyers to sellers has dropped from a high of 18.76 in 2020 to 10.68. This means that there are 10.68 buyers for every seller on Etsy.
Summary
I hope you enjoyed this initial analysis of Etsy, and that it gave you a better understanding of how the platform is trending overall. There is a lot more information we didn’t have space for, as this article was getting quite lengthy.
If you like this type of analysis, could you do us a favor? Could you add a comment or share on a social network with others that might find it interesting? If we see enough interest, we will keep going on our deep dives into the financial report to pull out additional insights.
Also, please consider buying a subscription to the magazine if you’d like us to continue doing in depth analysis on craft industry data. We appreciate your support!


